API Dashboard & Widgets
The API Dashboard brings your external data — tickets, projects, workflow runs, CRM records — into plemeo.ai as synced tables and lets you build a personal grid of KPI and chart widgets on top of them. A dedicated Process Analysis view on top of the same data surfaces throughput, average cycle time, distribution, and outliers for your tickets.
Overview
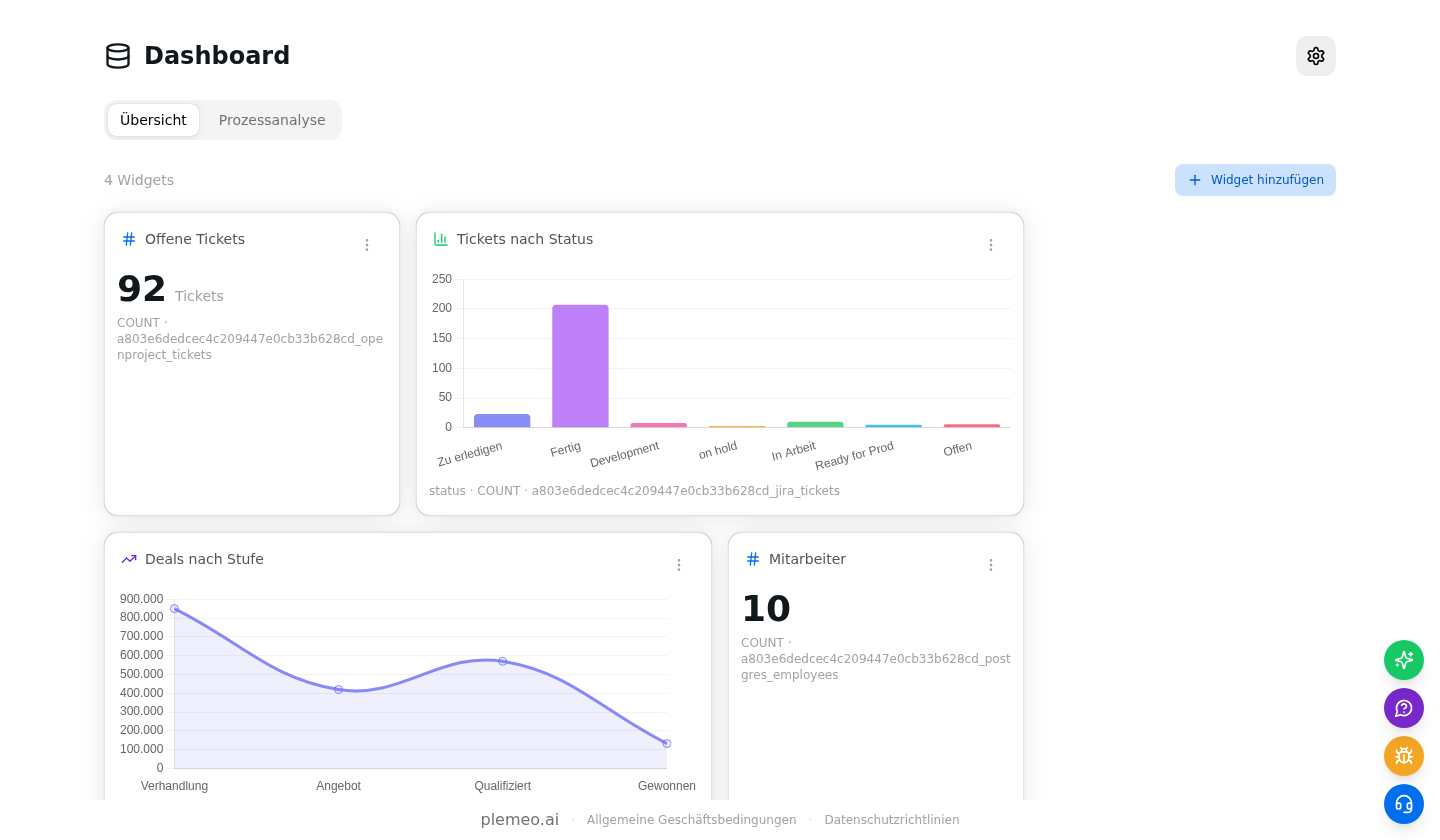
The Widget Dashboard lives at /dashboard inside plemeo.ai. It is organised around three building blocks:
- Integrations connect an external system (OpenProject, Jira, MySQL, PostgreSQL, or plemeo's internal n8n/workflow data) to your organisation.
- Tables are the synced datasets that integrations produce. Each table is a flat snapshot with a configurable sync interval.
- Widgets are the cards you place on the overview tab. They read from a single table and render a KPI, a line, or a bar chart.
Widgets are stored per device in your browser (via localStorage, key dashboard_widgets). They do not sync to other devices and they are not shared with teammates. Integrations and tables, on the other hand, live server-side and are shared across everyone in your organisation.
Who can do what
Every user can create, edit, or delete widgets on their own device. Only organisation admins can create, edit, or delete integrations and trigger manual syncs. Everyone with dashboard access can view the synced tables.
Connecting a data source
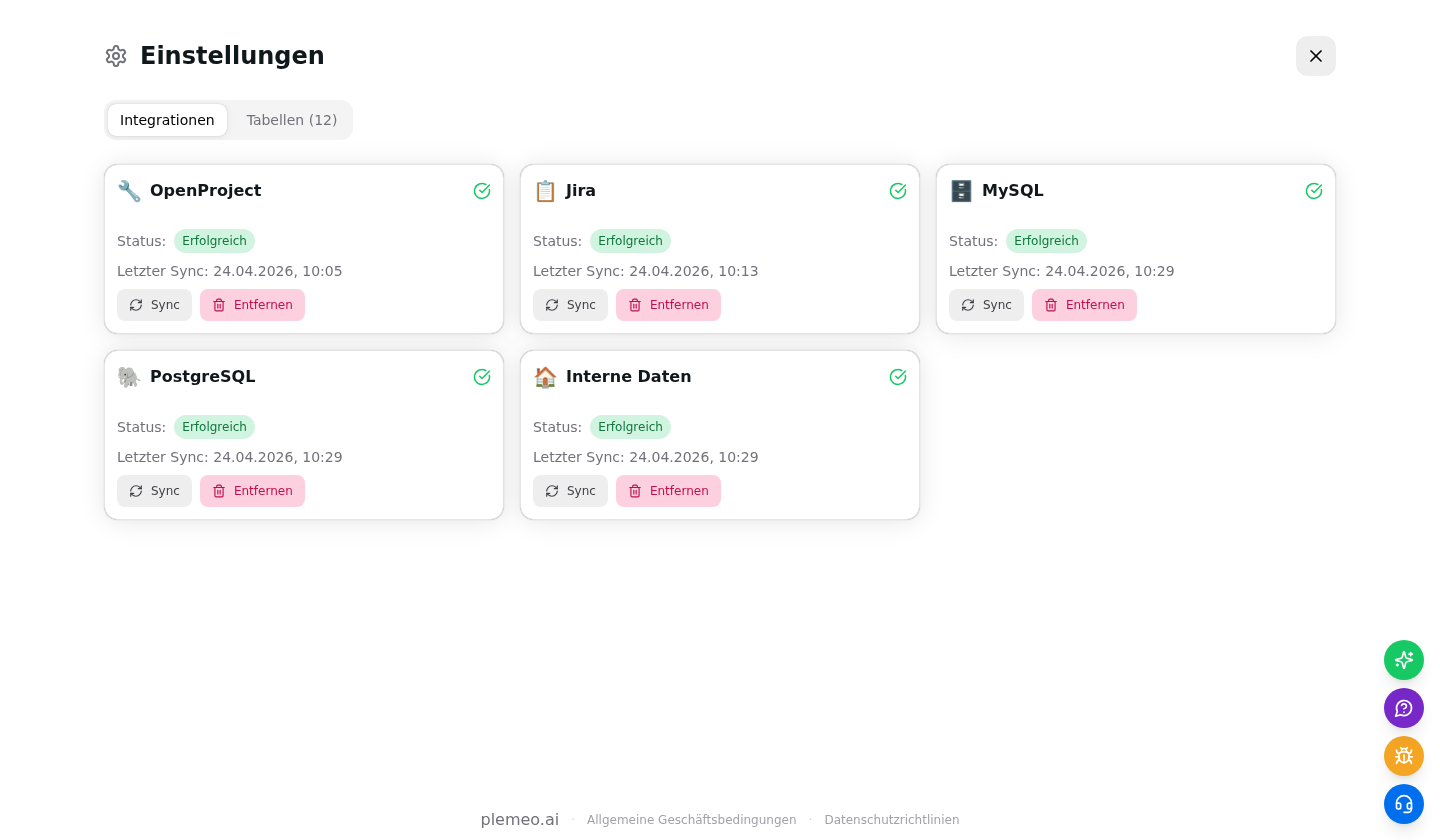
Open the dashboard and click the gear icon in the top-right corner to open the settings drawer. The Integrations tab shows all active connections for your organisation and their last sync time.
To add a new source:
- Click Add integration and pick a type (OpenProject, Jira, MySQL, PostgreSQL, or Internal data).
- Fill in the connection details (base URL and API token for OpenProject / Jira, or host / database / credentials for SQL sources).
- Click Test connection to verify the settings, then Save & start sync.
- The first sync runs immediately; subsequent syncs run automatically every 30 minutes by default. Use the Sync button on the card to trigger a manual sync at any time.
Each integration shows a status chip — Successful, Running, Error, or Partial — next to the last sync timestamp, so you can tell at a glance whether data is fresh.
Browsing tables
Switch to the Tables tab in the settings drawer to see everything that has been synced so far, grouped by source. Each row shows the source, the logical entity (for example tickets or projects), the internal table name, the row count, and the last sync time.
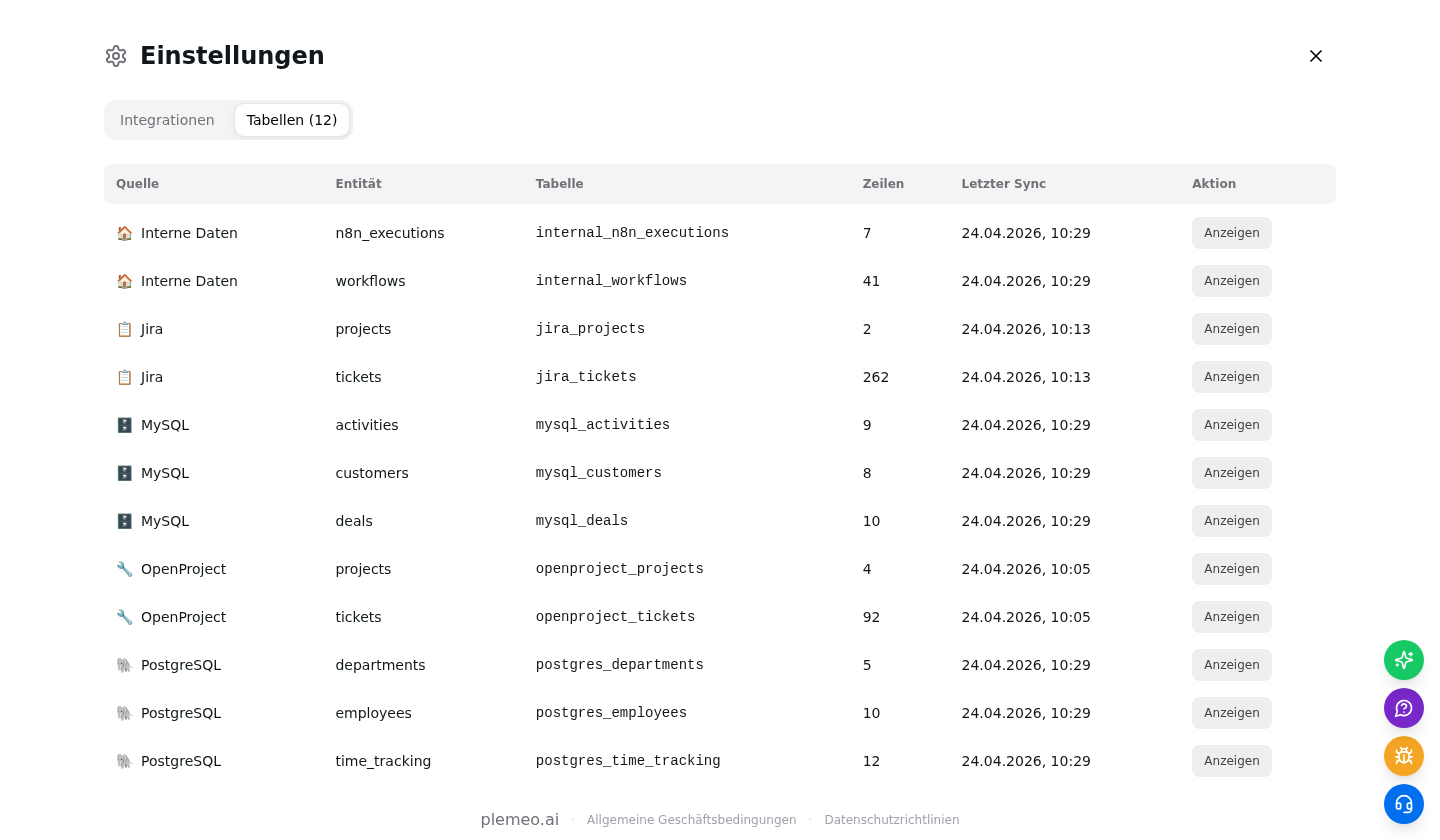
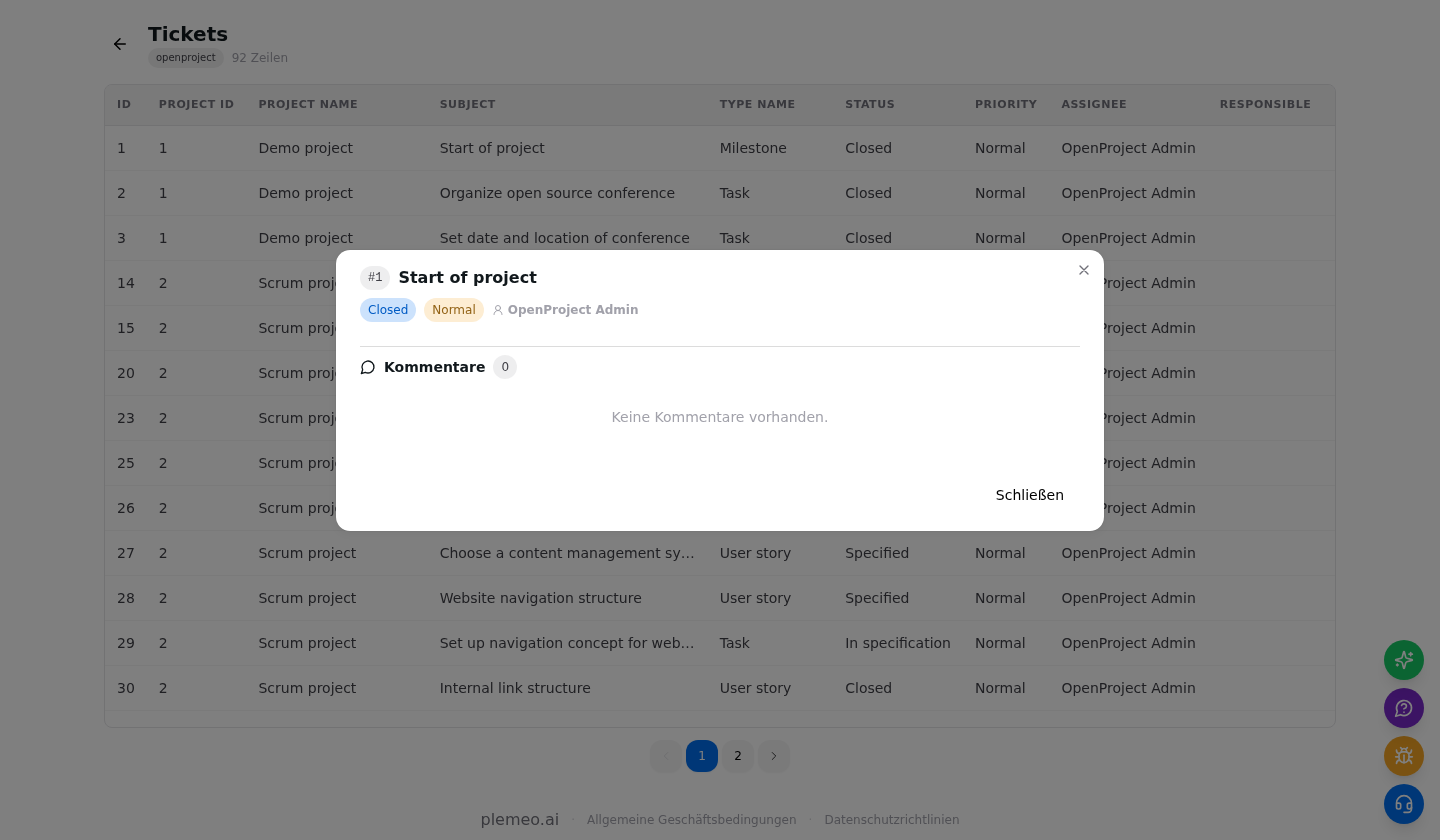
Click View next to a row to open the drill-down. The table renders the real, typed data with sortable columns, pagination, and — where meaningful — filter chips at the top (status, priority, assignee, and so on).
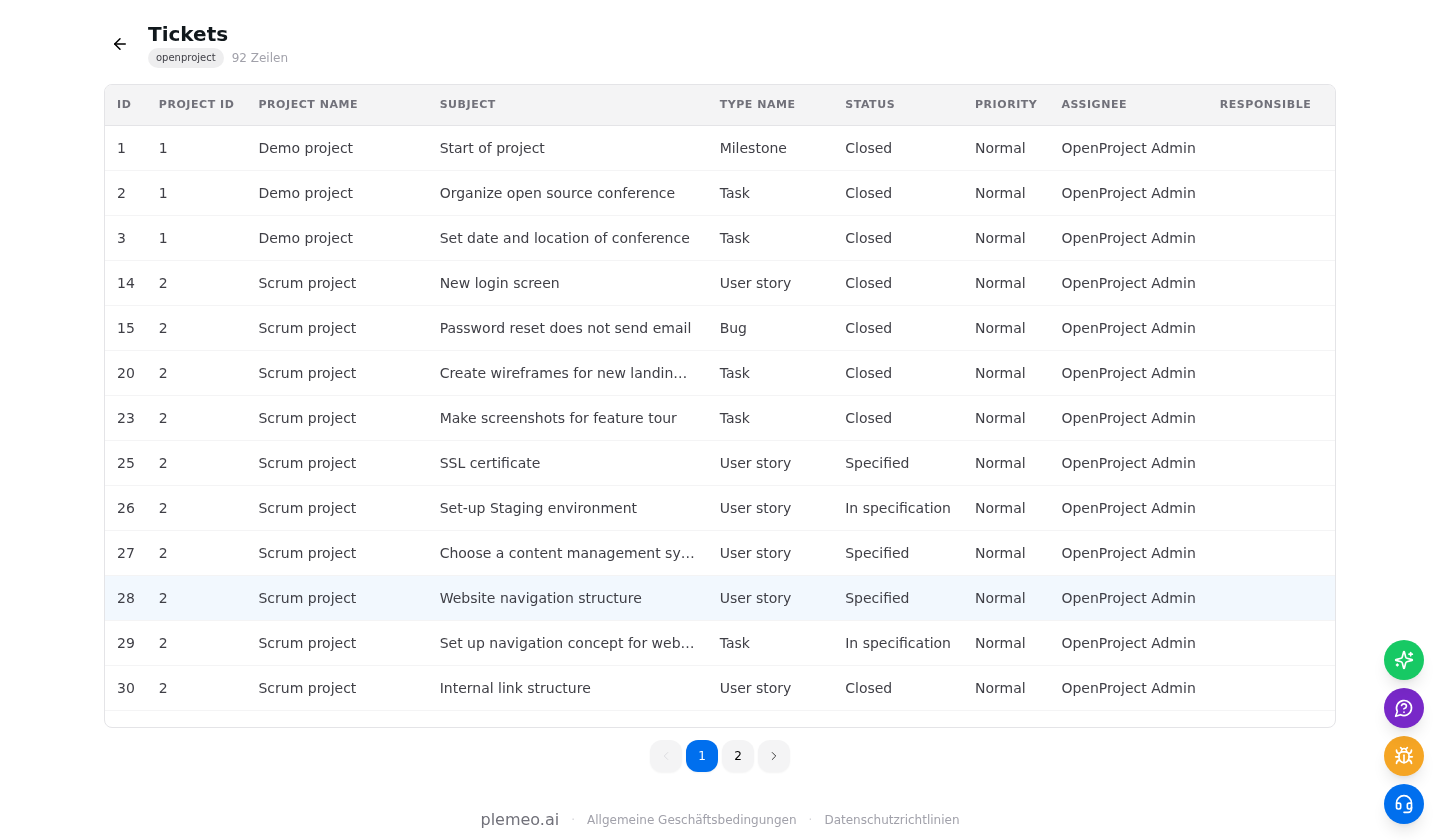
For OpenProject and Jira tickets the first column is clickable: clicking a row opens a modal with the ticket metadata and the most recent comments, so you can triage straight from plemeo.ai without switching tools.
Building widgets
Go back to the Overview tab and click Add widget in the header.
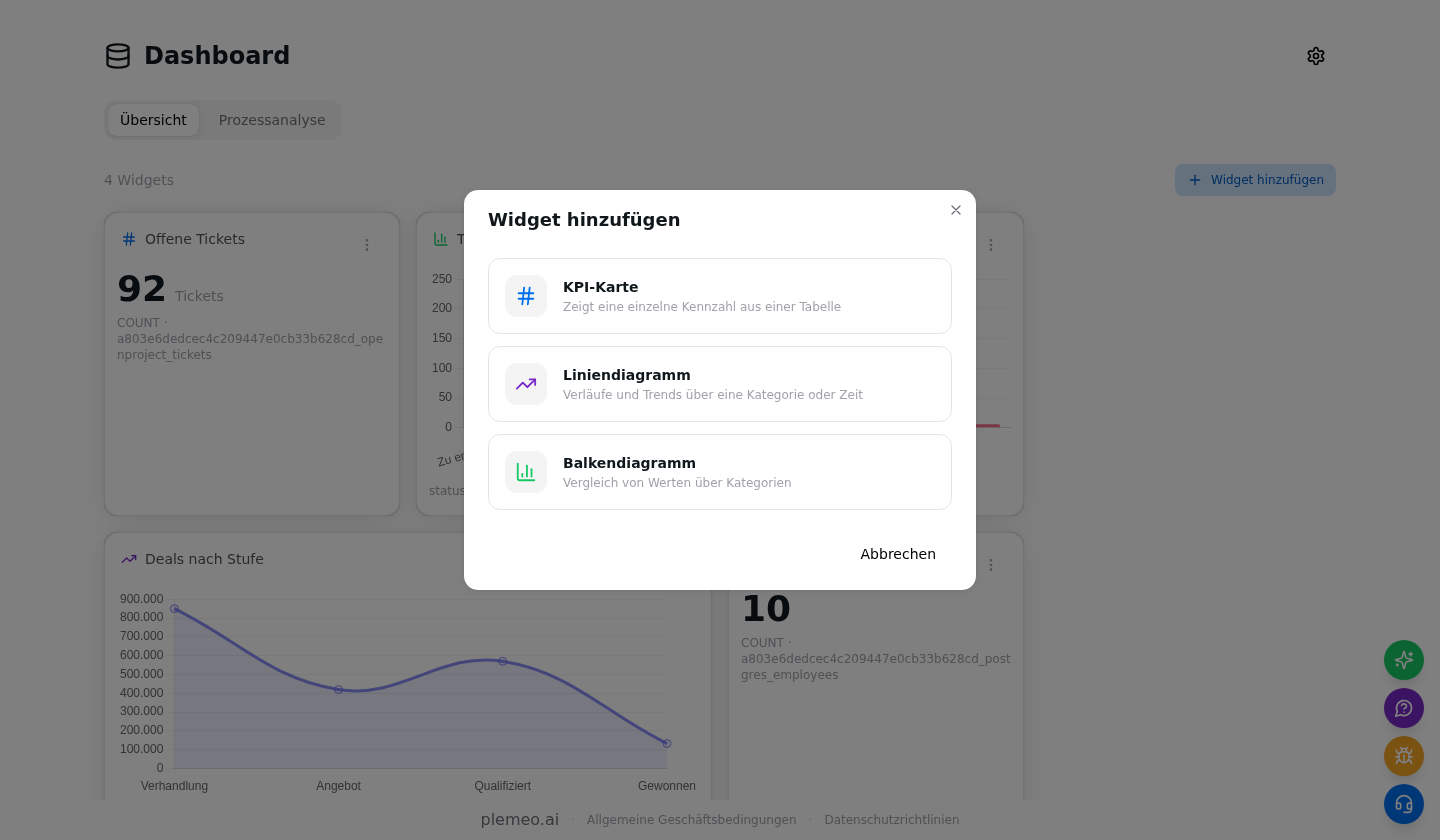
Step 1 asks you to pick a widget type:
| Type | What it shows | Good for |
|---|---|---|
| KPI card | A single number | "Open tickets", "Total revenue", "Active workflows" |
| Line chart | A trend across a category or time | "Tickets closed per week", "Deal value over stage" |
| Bar chart | A comparison between categories | "Tickets per status", "Revenue per customer" |
Step 2 configures the widget:
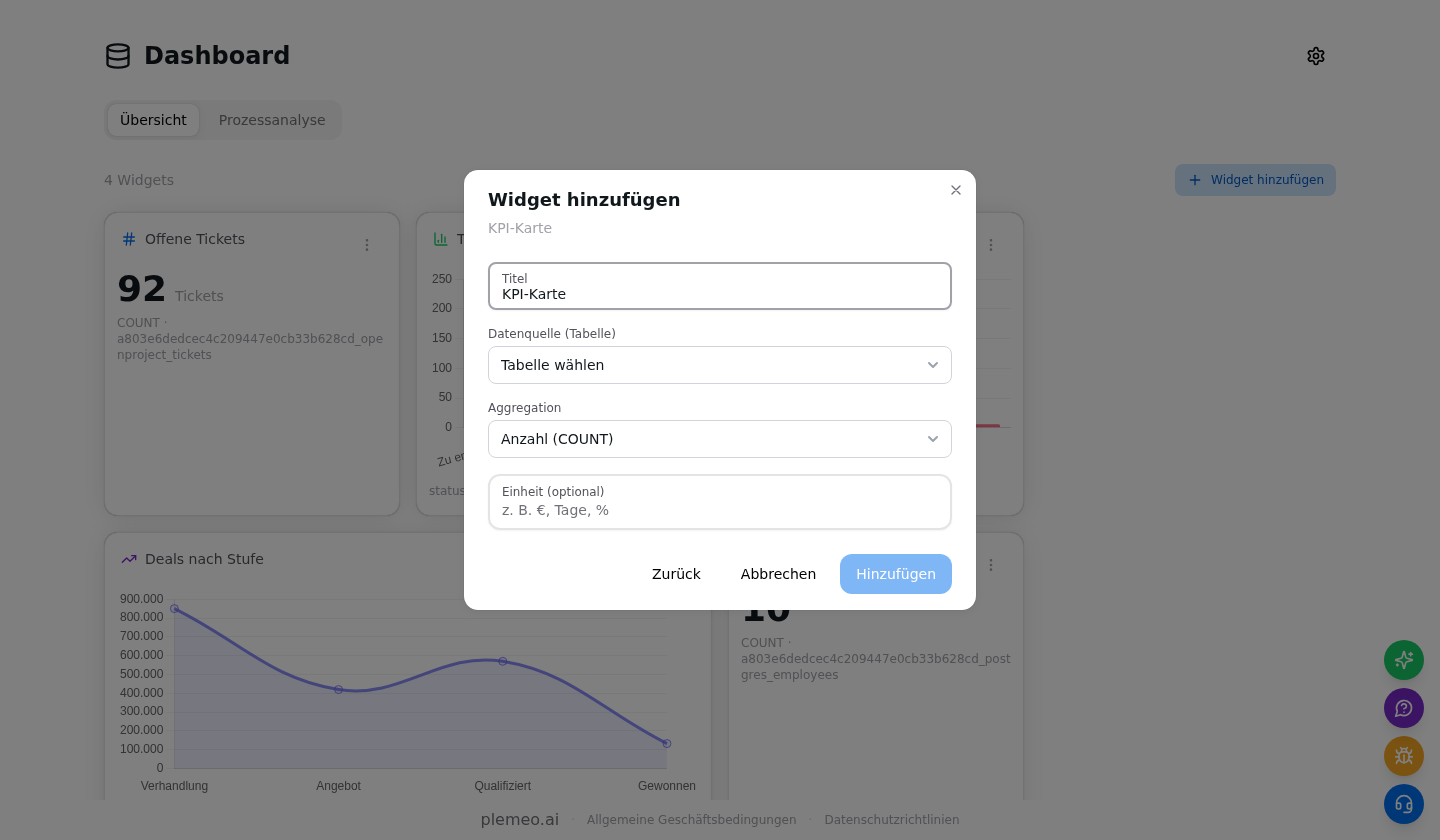
- Title — free text that appears on the card.
- Data source — the synced table to pull from.
- Aggregation — one of
count,sum,avg,min,max.countis the only aggregation that does not require a numeric column. - Column (KPI) or X axis / Y axis (charts) — which fields to plot.
- Unit (KPI, optional) — appended after the number, for example
€,days,%.
Click Add to save. The widget appears immediately in the grid.
Managing widgets
Every widget has a triple-dot menu in its top-right corner with Edit and Delete.
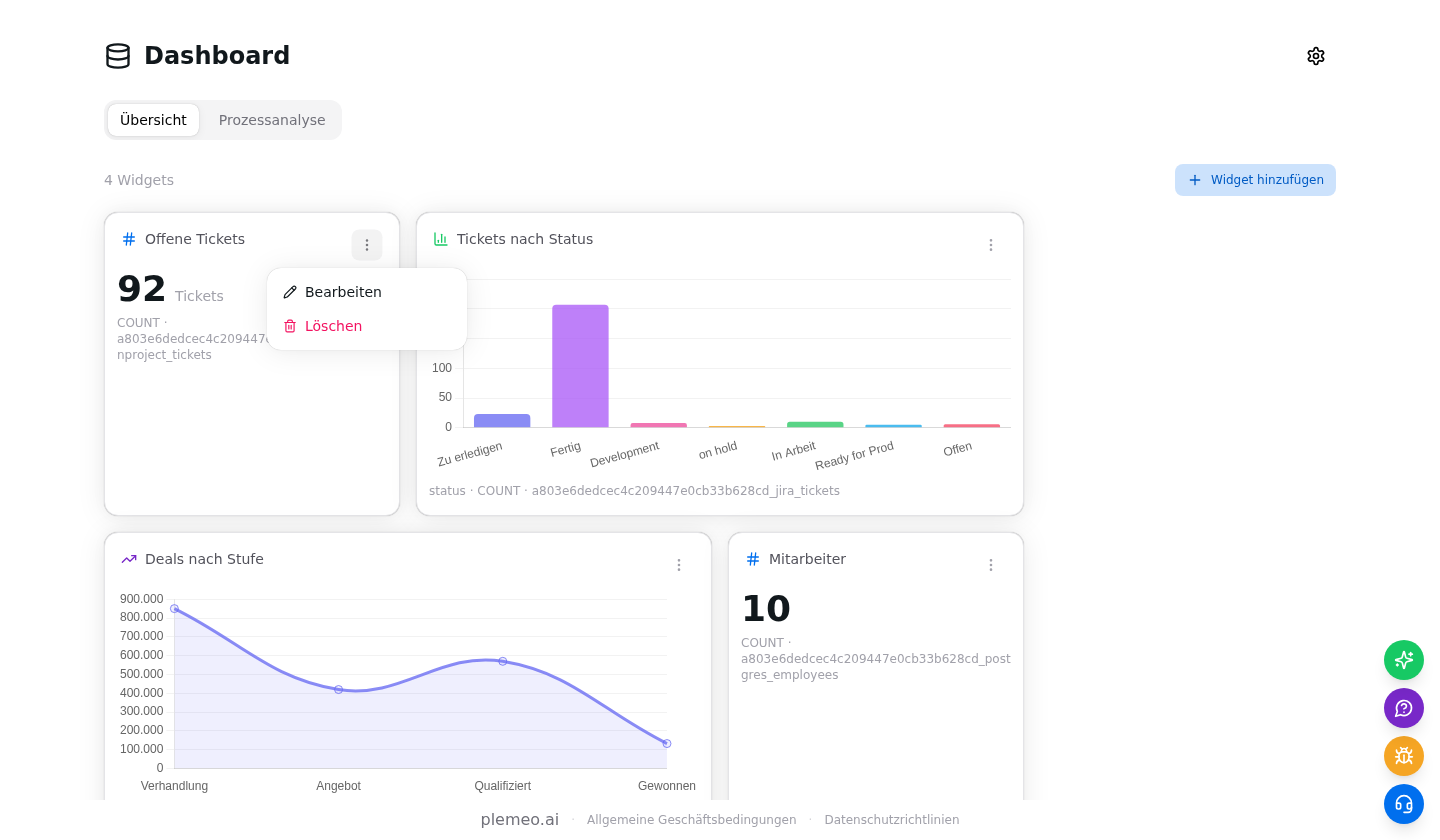
Editing re-opens the modal pre-filled with the current configuration, so you can tweak aggregations, axes, or titles without recreating the widget. The grid itself lays out KPI cards at one column wide and chart widgets at two columns wide on large screens, and collapses to a single column on mobile.
Row limit for aggregation
For performance, widgets aggregate on the first 1 000 rows returned from the table. This is more than enough for typical process KPIs, but be aware that very large tables will need filtering or a dedicated view if you need to aggregate everything.
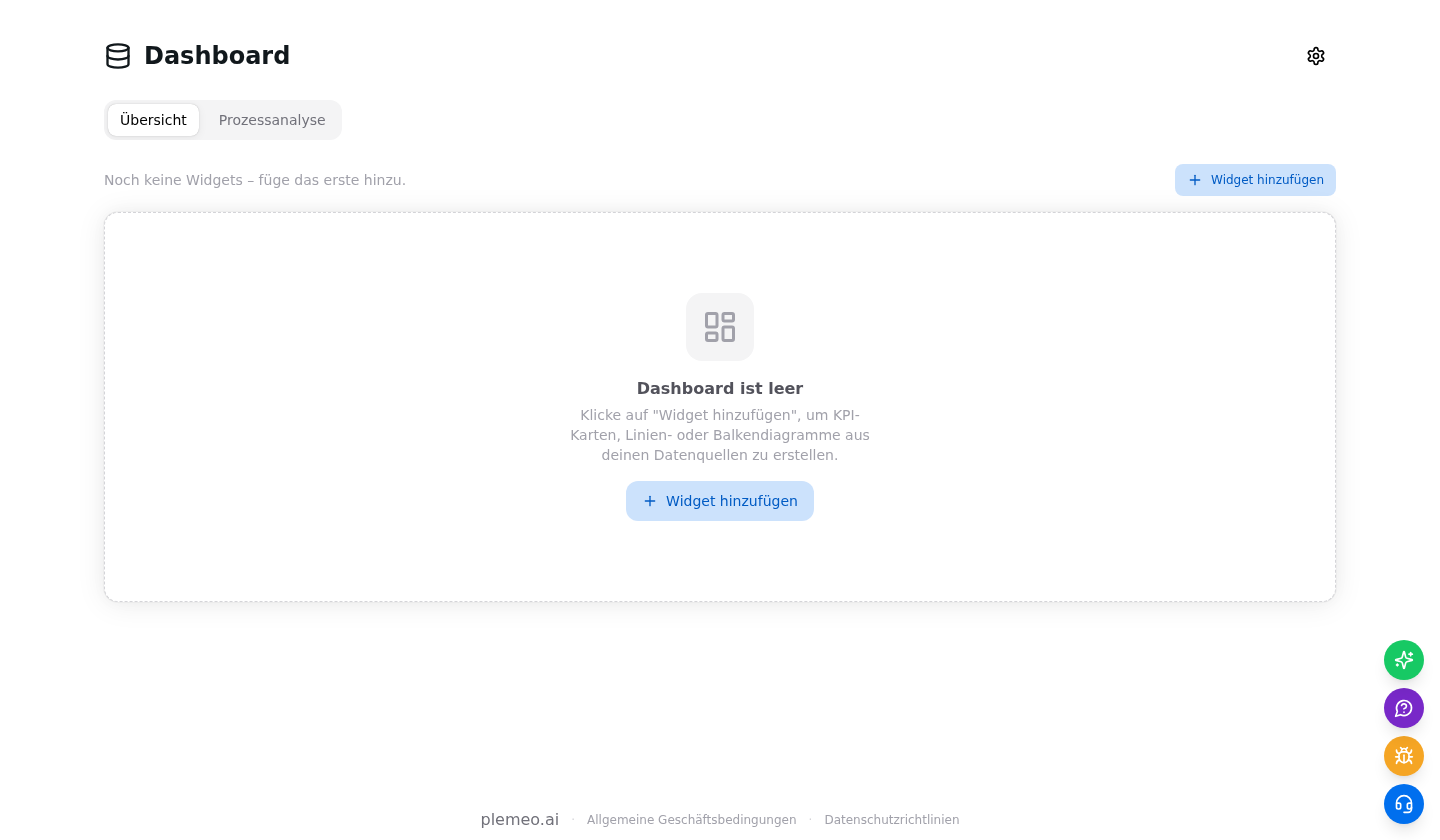
If the dashboard is new and you have no widgets yet, you will see the empty state with a big Add widget call-to-action.
Process analysis
The Process Analysis tab runs a set of statistical queries over your ticket tables (OpenProject + Jira combined) and renders four summary cards plus two charts.
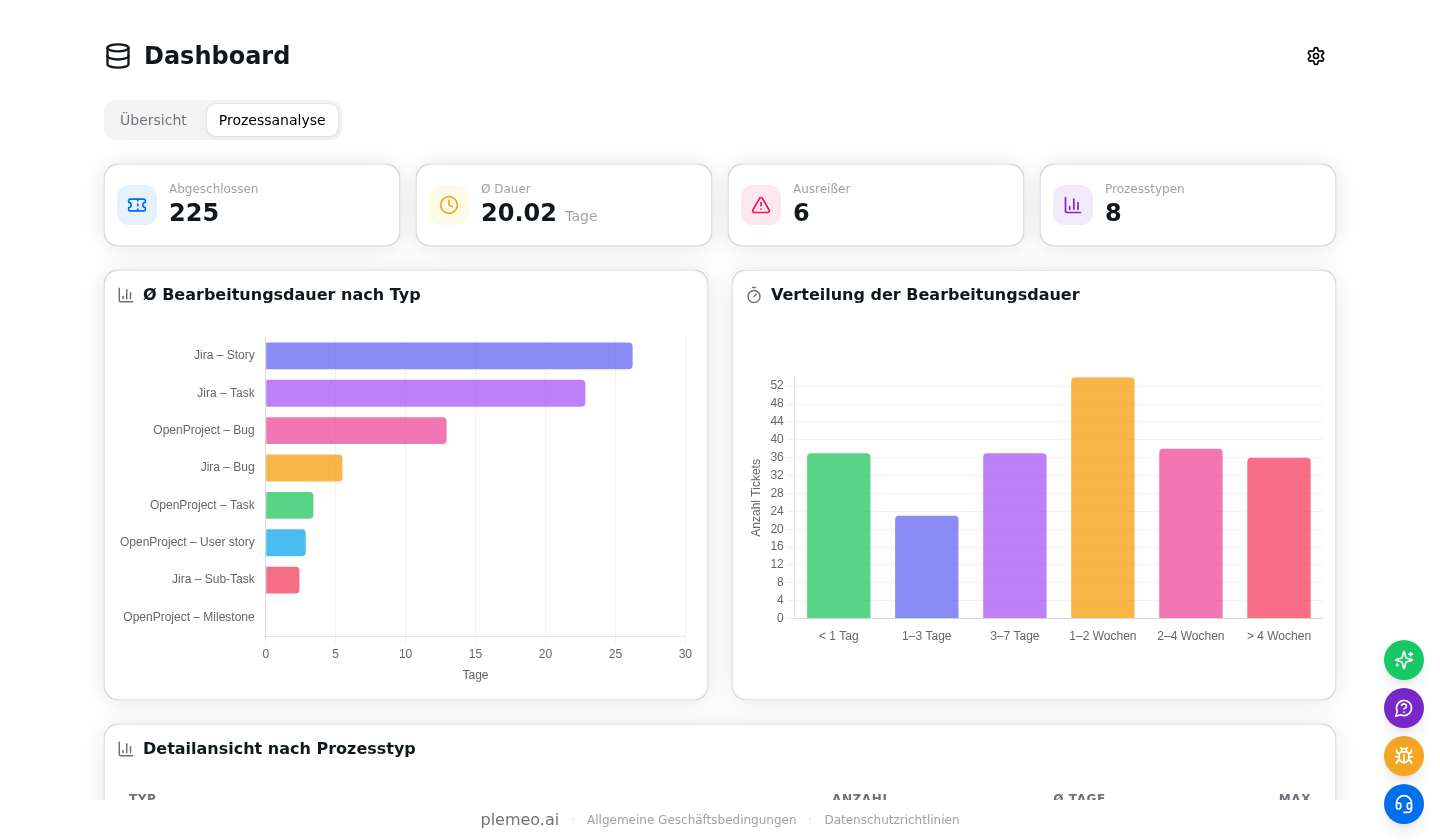
- Completed — number of tickets that have a completed timestamp in the selected period.
- Average duration — mean time from creation to completion, in days.
- Outliers — tickets whose duration is more than two standard deviations above the mean.
- Process types — number of distinct ticket types (Story, Bug, Task, …) found in the data.
The Average duration by type chart compares how long each ticket type takes on average, and the Duration distribution histogram buckets every ticket into < 1 day, 1–3 days, 3–7 days, 1–2 weeks, 2–4 weeks, > 4 weeks.
A detail table at the bottom shows, per type, the count, average, minimum, and maximum duration. When there are outliers, a second table lists them with a direct link back to the ticket view.
Limits and FAQ
Where are widgets saved? In the browser's localStorage under the key dashboard_widgets. Clearing the site data wipes your widgets, and widgets do not follow you to another device or another browser profile.
Do I share widgets with my team? No. Each user builds their own grid. Integrations and synced tables are shared, so if an admin connects a source, everyone can build widgets on top of it.
How fresh is the data? Integrations sync every 30 minutes by default. The last sync timestamp is visible on every integration card and on every row of the Tables tab. Hit Sync for an on-demand refresh.
Which integrations are supported? OpenProject, Jira, MySQL, PostgreSQL, and the internal n8n / workflow data that plemeo.ai already collects. More sources are planned.
Can I export data? Yes — every drill-down table supports column sorting and pagination; use your browser's print view or a screenshot for a quick export. For programmatic access, ask your admin to expose the dashboard API directly.
Why does a widget show 0 or nothing? Check that the selected table has data (Tables tab shows the row count), that the aggregation column is numeric for sum / avg / min / max, and that the source integration has completed its first sync without errors.