Viewing Reports
Once the configuration is complete, you can view your campaign data in comprehensive report form. Meta Insights provides detailed analytics to help you make data-driven decisions about your advertising campaigns.
Available Metrics
The Meta Insights reports include the following key performance indicators:
- Ad Budget - Total allocated budget for campaigns
- Impressions - Total number of times your ads were displayed
- Reach (unique) - Number of unique users who saw your ads
- Link Clicks - Number of clicks on your ad links
- CPC (Cost per Click) - Average cost for each click
- CTR (Click-through Rate) - Percentage of impressions that resulted in clicks
- Audience Age Distribution - Breakdown of your audience by age groups (e.g., 20–30, 31–40)
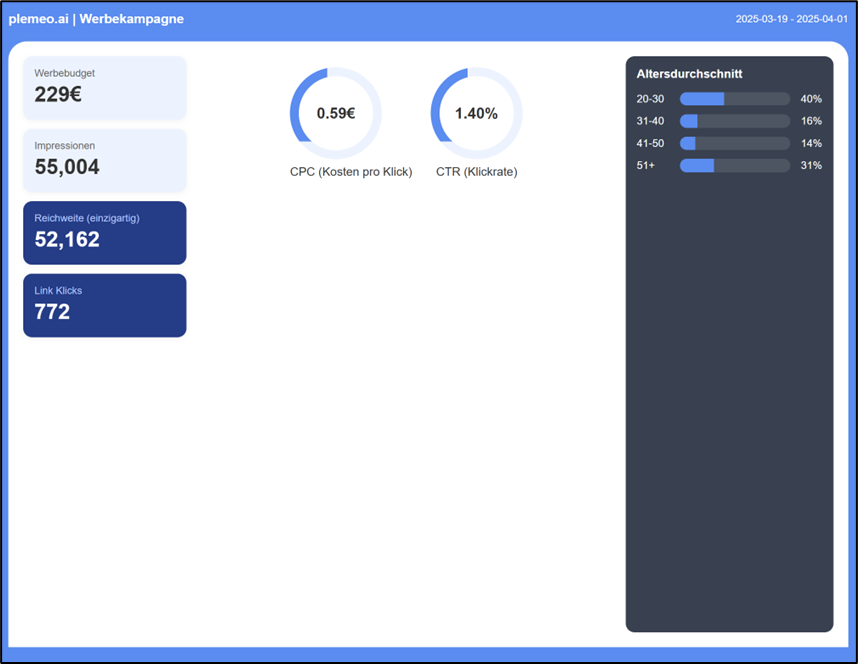 Meta Insights dashboard showing various metrics
Understanding Your Data
Performance Indicators
Cost Per Click (CPC)
- Good CPC: Varies by industry, but generally lower is better
- Factors affecting CPC: Audience targeting, ad relevance, competition
Click-Through Rate (CTR)
- Average CTR: Typically 0.5% - 2% for Facebook ads
- Higher CTR indicates: More engaging ad content and better targeting
Return on Ad Spend (ROAS)
- Calculation: Revenue generated / Ad spend
- Benchmark: 4:1 ROAS is often considered good (4€ revenue for every 1€ spent)
Demographic Insights
Use age and geographic data to:
- Optimize targeting for better-performing demographics
- Adjust ad content to resonate with your primary audience
- Allocate budget more effectively across different segments
Using Reports for Optimization
Campaign Performance Analysis
- Identify top-performing campaigns by CTR and ROAS
- Analyze underperforming ads and consider pausing or modifying them
- Compare different ad formats to see what resonates with your audience
Budget Allocation
- Increase budget for high-performing campaigns
- Reduce spend on campaigns with poor ROAS
- Test different budget distributions across demographics
Audience Insights
- Expand successful demographics in your targeting
- Create lookalike audiences based on high-converting segments
- Adjust ad creative to better match audience preferences
Accessing Your Reports
- Navigate to My Apps
- Click on Meta Insights
- Click "Export Reports" - the report will be downloaded as an HTML file
Best Practices
Regular Monitoring
- Check reports daily for active campaigns
- Weekly analysis for trend identification
- Monthly deep dives for strategic adjustments
Data-Driven Decisions
- Use A/B testing insights from reports to optimize ads
- Track conversion metrics beyond just clicks and impressions
- Monitor competitor performance when possible
Report Sharing
- Export key metrics for stakeholder presentations
- Create custom dashboards for different team members
- Set up alerts for significant performance changes
Next Steps
- Return to Configuration if you need to update your settings
- Back to Overview for general information about Meta Insights
- Explore other Apps available in plemeo.ai